Results
There are three modes for obtaining and visualizing analysis results for
structures in Ftool. These are the Diagram, Influence Line, and
Load-Train Envelope modes of operation. Select the desired mode of
operation using the buttons on the results toolbars, as described below.
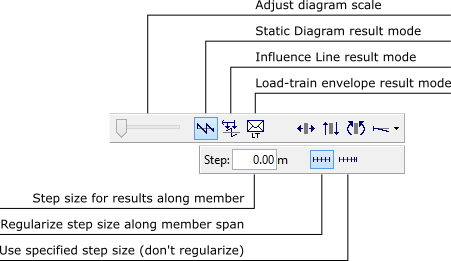
In Diagram and Load-Train Envelope modes, Ftool automatically
analyzes the structure using the stiffness method to construct the requested
diagrams. Just clicking on the appropriate button switches the display to show
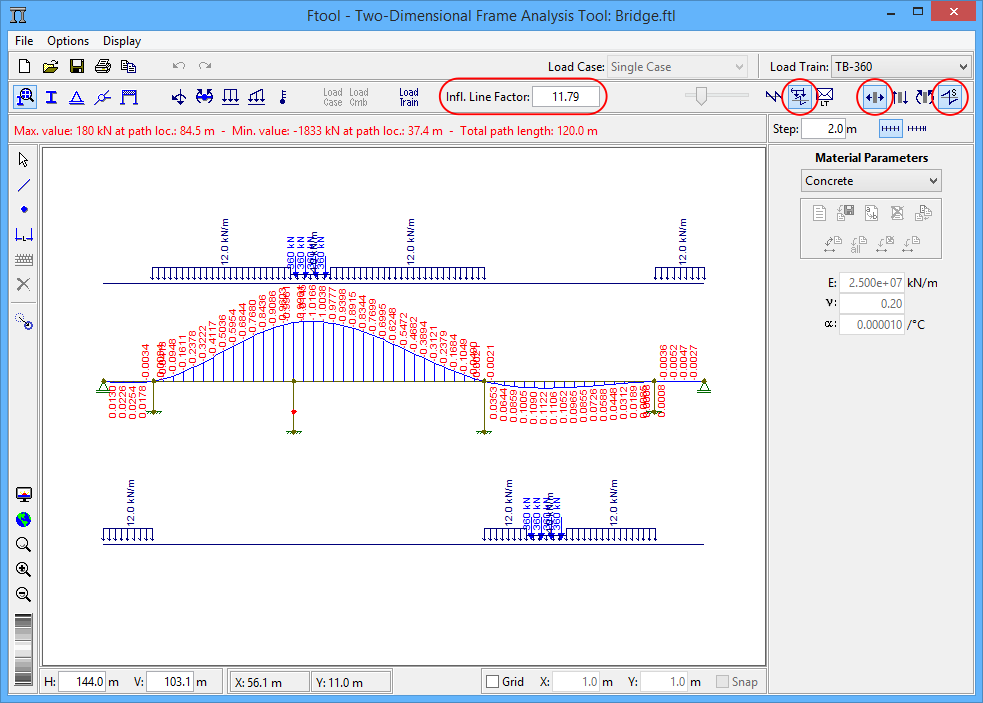
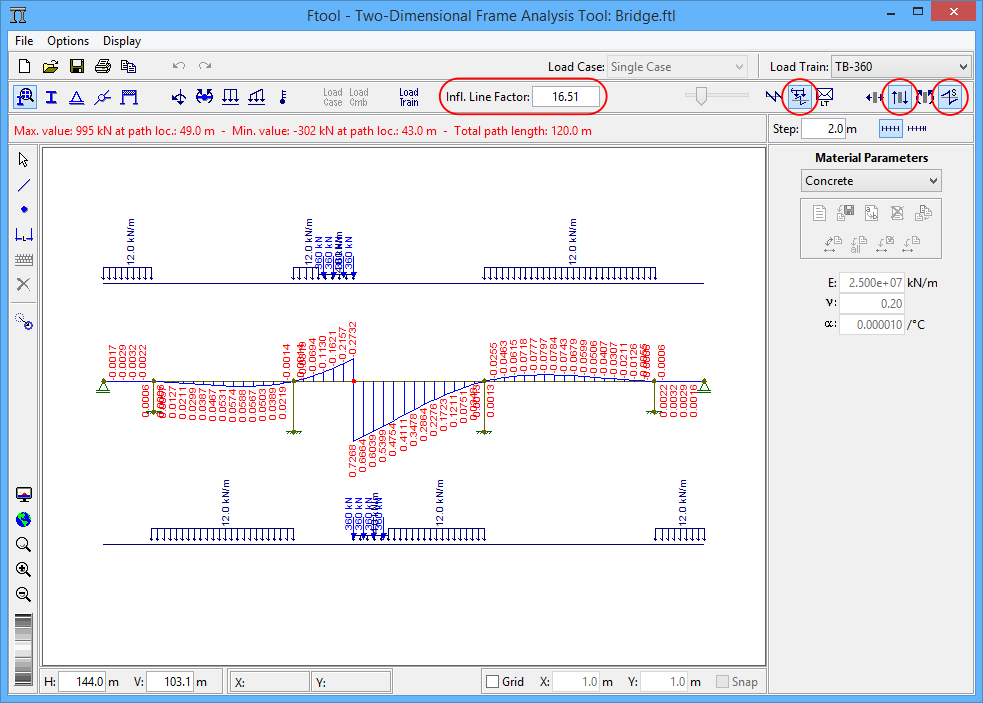
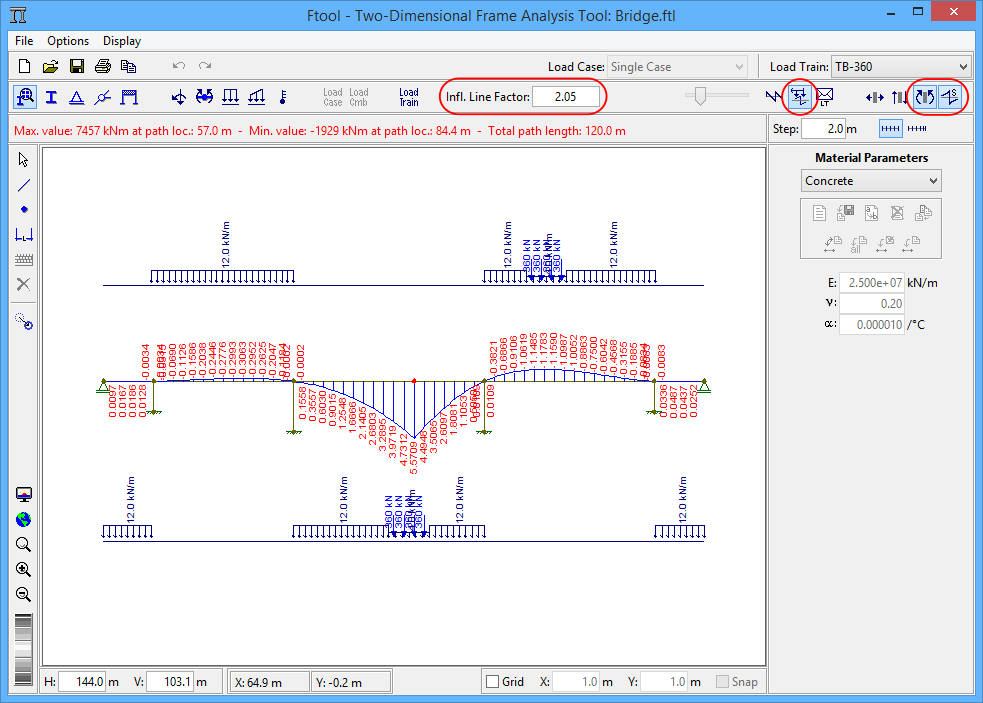
the desired result. In Influence Line mode, the program prompts the
user to indicate a cross-section on a member to display the desired influence
line.
If the Result Values display option is active (see
The Display Menu), the diagrams
will be plotted with printed nodal values. Local maxima and minima will also
be printed if present. If the Step Values display option is active,
values will be printed along the diagram according to the defined result step
size.
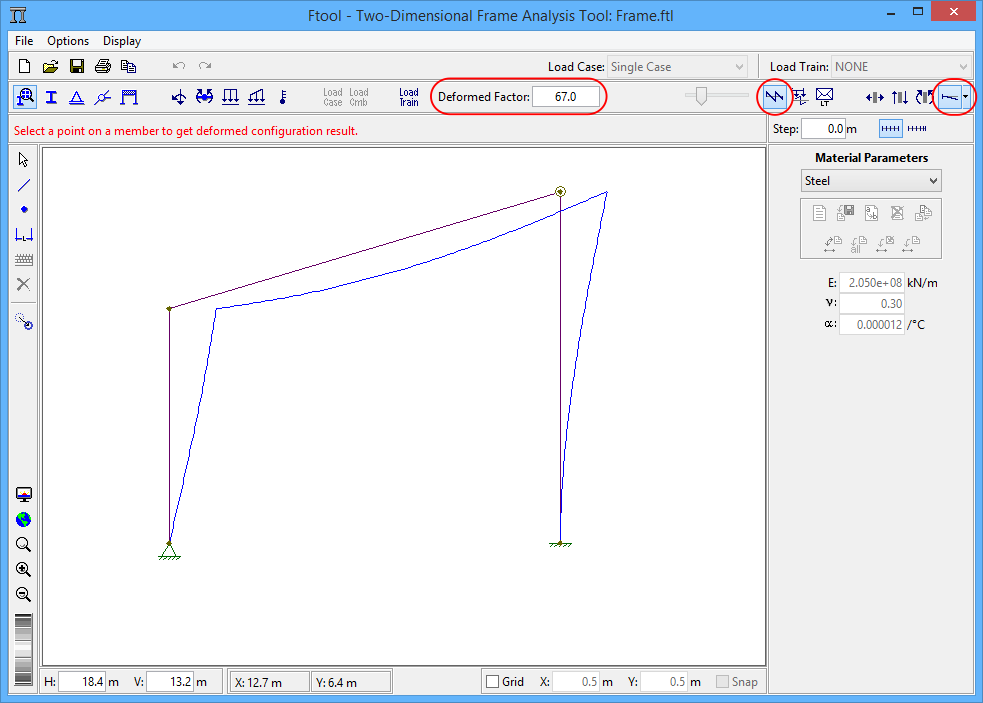
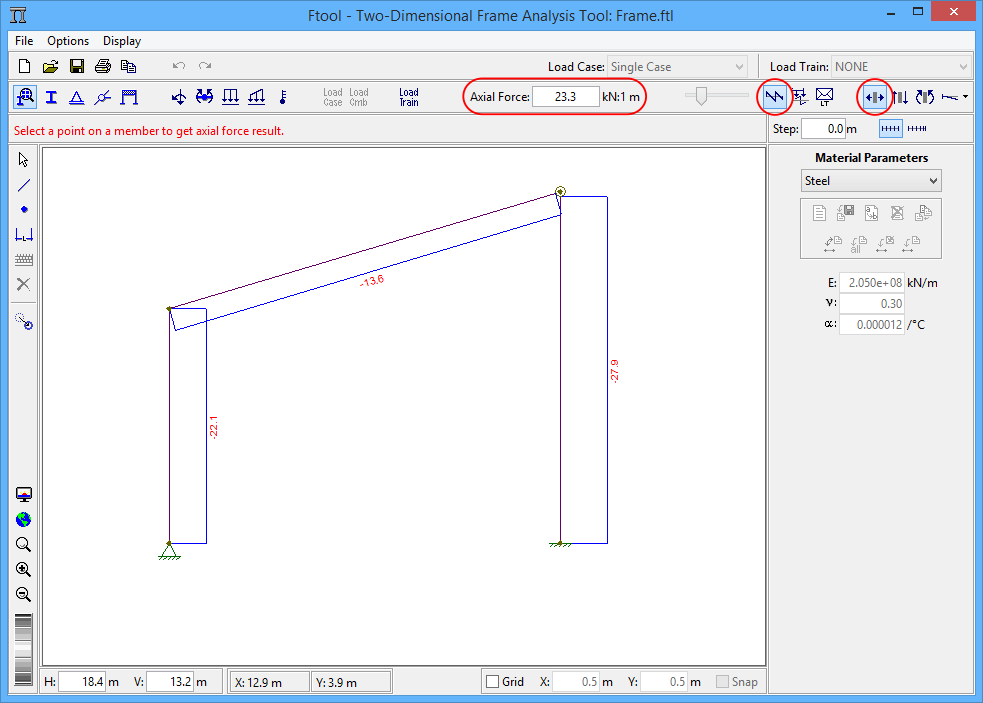
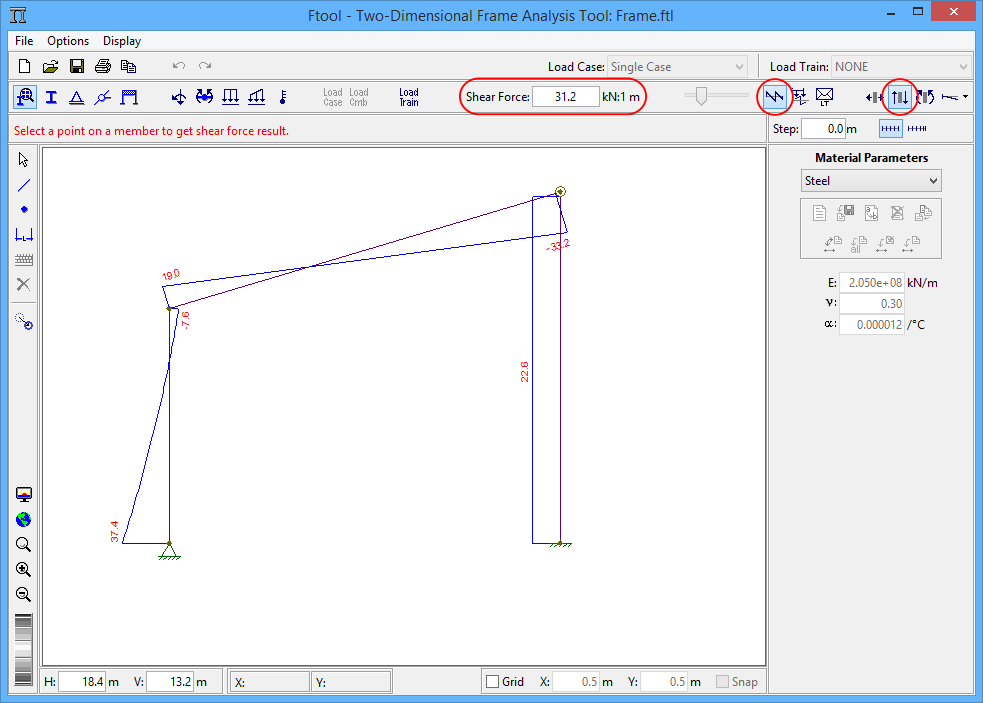
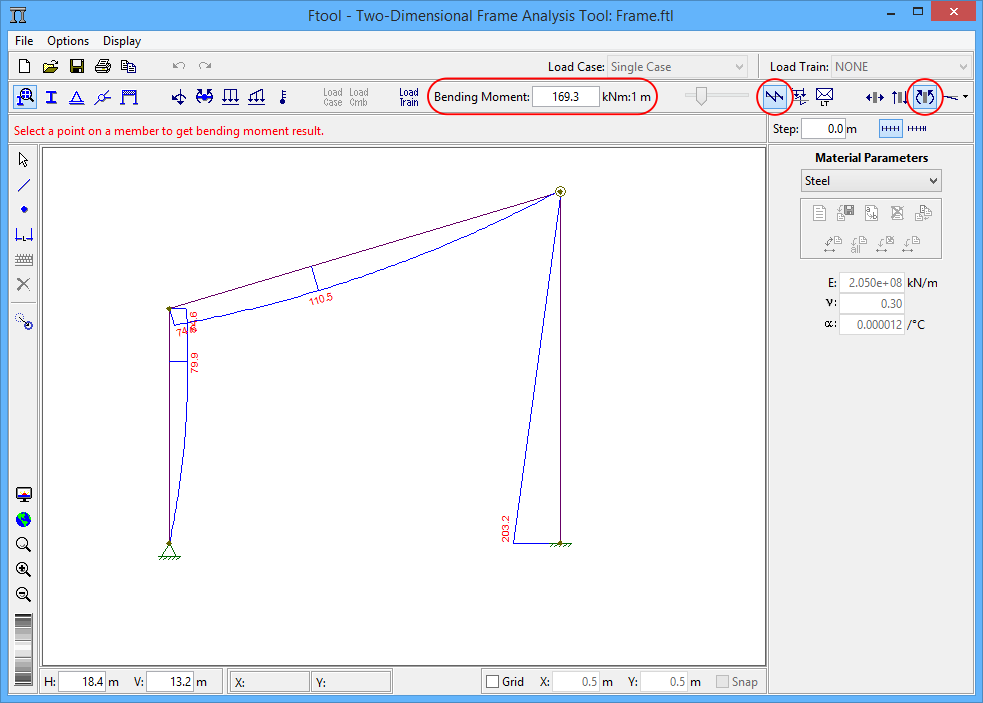
Diagram result mode considers the visualization of internal force diagrams
(axial forces, shear forces, bending moments) and deformed configuration under
static loads.
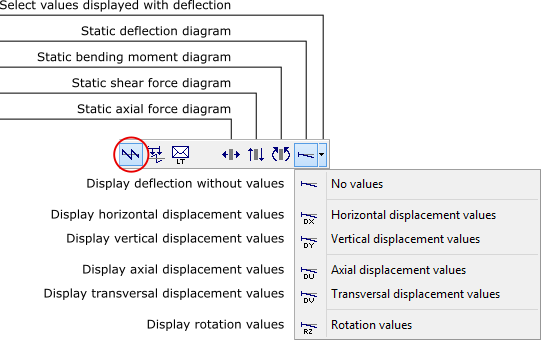
For the deformed configuration diagram, the user must select which of the
deflection components to print with the diagram: the rotation, horizontal or
vertical displacement or none at all. The plotted diagram itself is the same
regardless of the selected value.
To get numerical results of a diagram, move the mouse cursor to a position
on a member and click the left mouse button. The desired values will be
displayed on the top line message. Additional results may be consulted
clicking the right mouse button. These results will be displayed on the
lateral area of the screen (see Numerical Display of
Results).
In this mode the user may apply transformations that do not alter the
structure’s topology (see
Transformations). To do so, the user must open the transformations
window, select the desired objects and then apply the transformations. The
results are automatically updated, maintaining their scale.
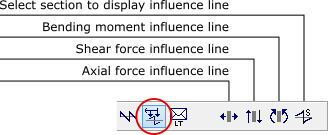
In Influence Line mode, first click on a button for the desired
type of influence line (e.g., shear force or bending moment). Then place the
mouse cursor at some point along a member and click the left mouse button.
Ftool imposes the required unit displacement or rotation discontinuity to
create the desired influence line, which is displayed on the structural model.
To display an influence line, the program ignores the applied loads on the
structure. An influence line represents the effect of a unitary vertical force
that traverses the members of the structure. The unitary force has always a
vertical downward orientation, no matter the orientation of a member on which
the force passes.
In case there is a currently selected load-train (vehicle live load for
bridges), the critical positions of this load-train are displayed above and
below the displayed influence line. These critical positions are the ones that
cause the minimum (negative) and the maximum (positive) target result values
on the desired cross-section. In this case, the influence line is displayed
only along the members of the structure that belong to the load-train
path.
When it is not possible to automatically define a load-train path of
members along the structure, the program prompts the user to go selection mode
and to select a group of members that form a continuous and smooth path for
the load-train. When the user provides a valid load-train path, the program
stores the corresponding group of members and the user will be prompt again to
specify a load-train path only in case the model is modified.
As long as the button to select a cross-section (rightmost button of the
toolbar) is active, Ftool displays a new influence line for each selected
section. To avoid the selection of another section, deactivate this button.
When this button is not active, point results along the influence line may be
consulted by just selecting a target position using the left mouse button.
The desired value will be displayed on the top message bar. Additional member
results may be consulted using the right mouse button (see
Numerical Display of Results).
In this mode, the user may apply transformations which do not alter the
structure’s topology (see Editing -
Transformations). To do so, the user must define an influence line for
some point and then open the transformations window, select the desired
objects and apply the transformations. The influence lines are automatically
updated, maintaining their scale. Should one wish to then check another
influence line, one should simply select the desired result (or the button to
select a new section) from the menu once again. Should one wish to then apply
new transformations (with the transformation window already open), one must
press the Select button so as to allow for the selection of objects
prior to their transformation.
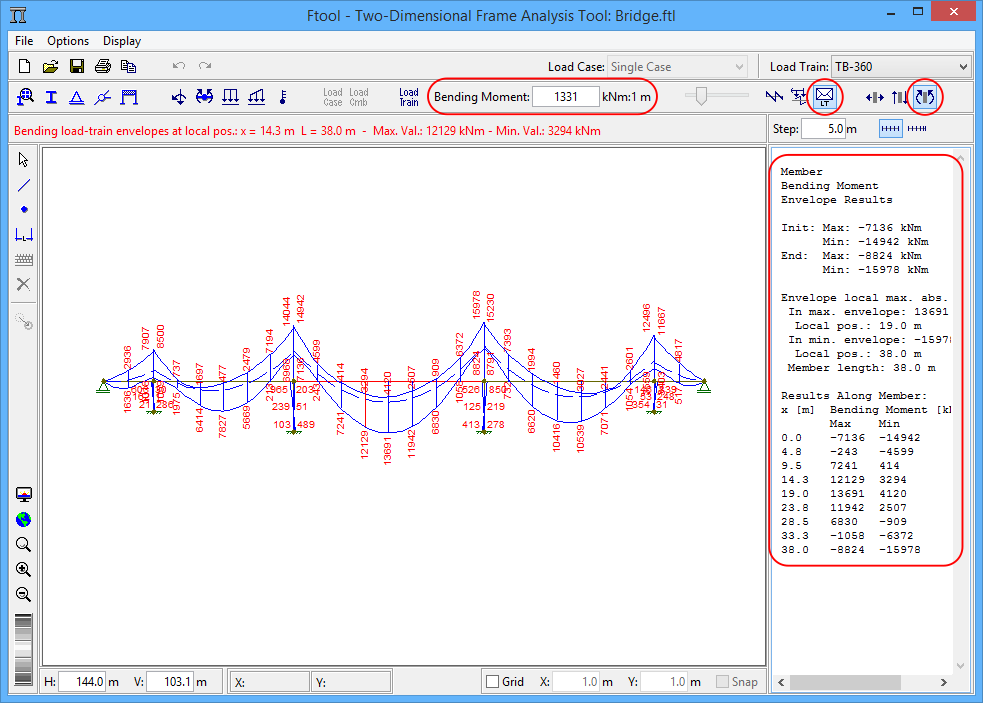
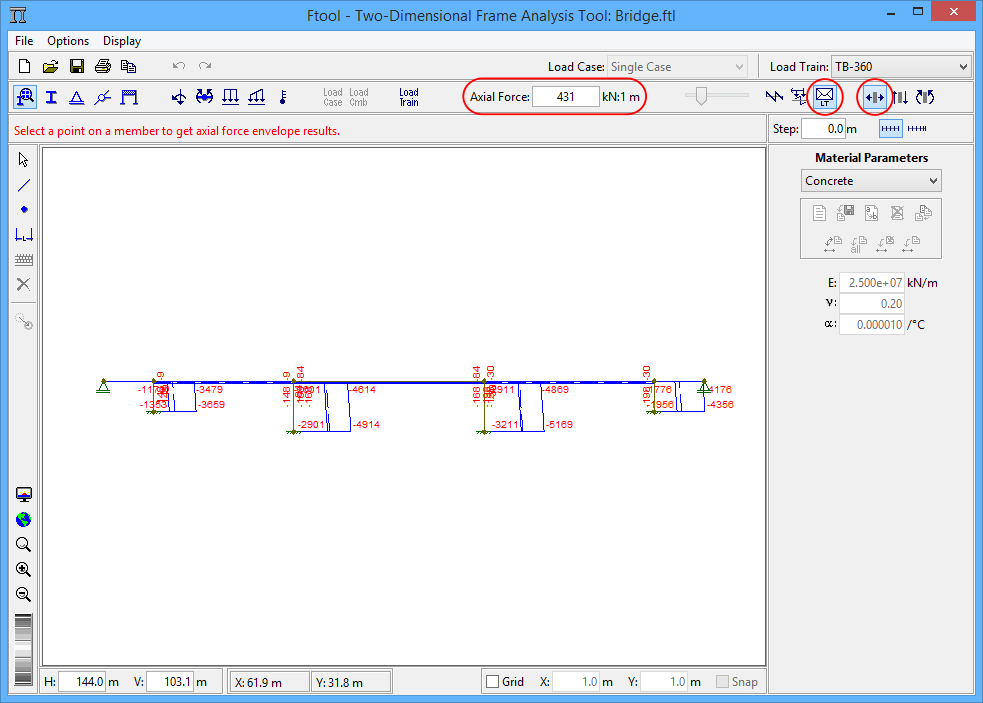
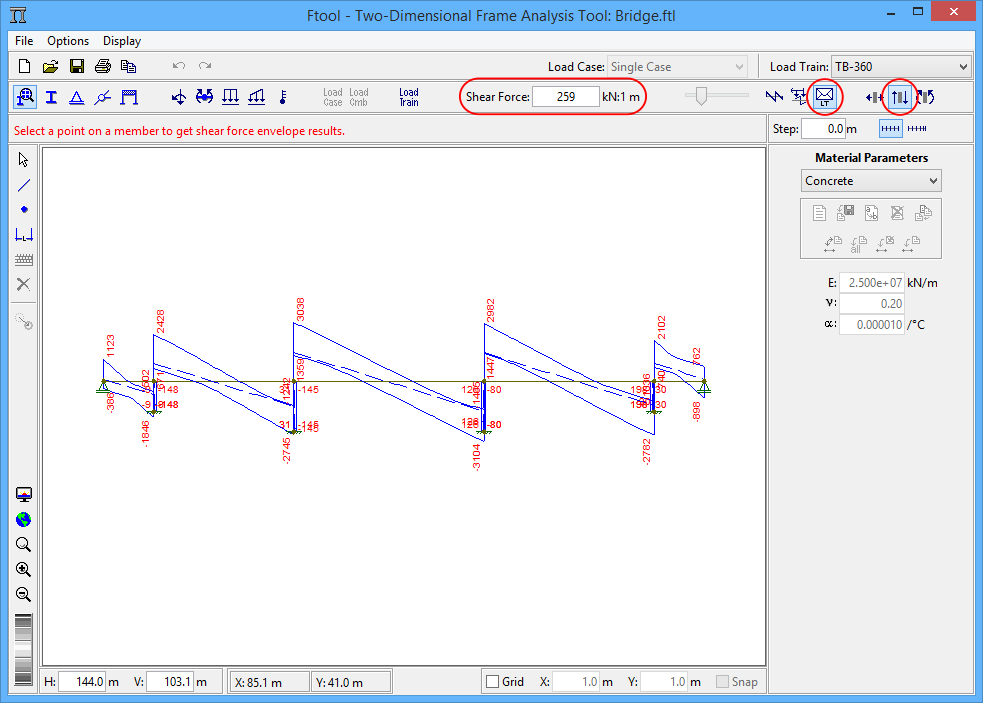
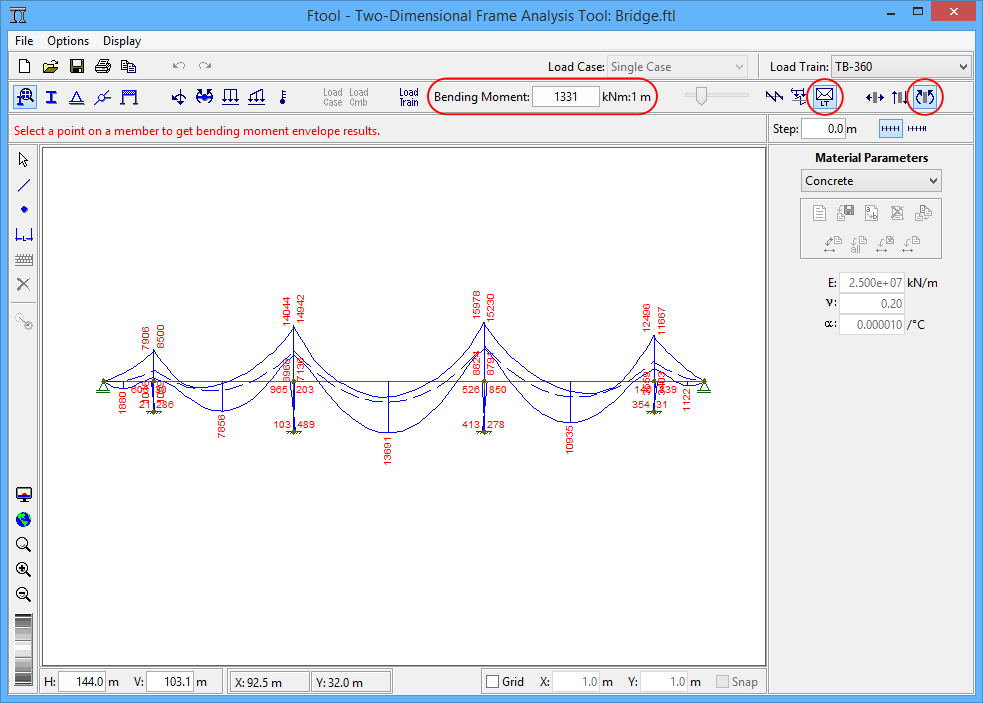
The Load-train Envelope mode is used to display envelopes of
limiting internal force values along a structure under moving loads.
Envelopes are diagrams of minimum and maximum values of an internal force
(axial, shear or bending moment) for the current load-train (vehicle live
load for bridges). If there is no current load-train, or if no load-train
path is defined, the program does not activate the Load-train Envelope
mode. The load-train path, if not automatically defined, has to be defined by
the user selecting a continuous and smooth chain of members prior to getting
an envelope result.

Envelopes of internal forces can be calculated adding the effects of
static loads to the current load-train (vehicle live load) effects. The
diagram of static internal forces due to static loads are displayed as
dashed lines on the envelope image. In the Options menu (see
Configurations - Superposition of static load
and load-train results), there is an item to activate and deactivate
the superposition of static and vehicle live load effects in the envelope
calculation. By default, this superposition is activated. This option is reset
when a new model is created or when a model is opened from a file.
The construction of the load-train envelopes interpolates minimum and
maximum results calculated at cross-sections automatically selected along the
members of the structure. For each selected section, Ftool builds the
corresponding influence line and finds the critical positions of the current
load-train that cause the minimum and maximum vales at that section. Envelopes
are diagrams that linearly interpolate the minimum and maximum values
calculated at the selected cross-sections. The same step used to build
internal force diagrams, deformed configuration, or influence lines is adopted
to select the cross-sections for the construction of the load-train envelopes.
Should the relevant option be active (see above), the envelopes are then
superimposed on the static load diagram.
Point results of load-train envelopes may be obtained by just selecting
a target position using the left mouse button. The minimum and maximum
values at that point are shown in the top message bar.
In this mode it is not possible to perform object transformations.
The sign convention for internal forces and moments can be displayed in the
program by selecting the option Sign Convention on the File menu.
A window appears on the screen which shows the sign convention.
The user may alter the sign convention for resulting diagrams and influence
lines.
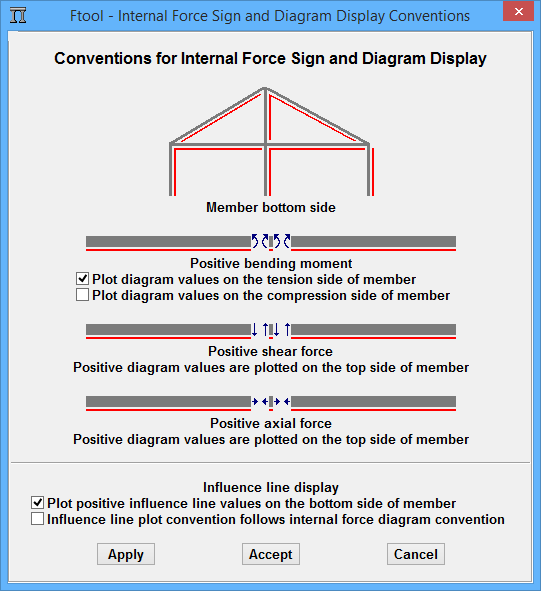
Top and Bottom Fibers
The sign convention for internal forces and moments depends on the
definition of the "lower" and "upper" fibers of the
members. In horizontal and inclined members, the lower fibers are in the
bottom when looking at the screen with the vertical axis in its natural
position (up). In vertical members, the lower fibers are on the right. The
figure at the top of the sign convention display indicates lower fibers of a
structure that contains members with all possible directions.
- Sign Convention for Diagrams
Ftool adopts the following convention for the signs of the internal forces
and moments and for the drawing of diagrams:
- Normal forces (axial):
Normal positive forces are tension forces.

- Shear forces:
Shear forces on the diagram below are positive.

- Bending Moments:
The sign convention shown below is adopted: positive moments causing
compression on the top fibers of members and tension on the bottom
fibers. Bending moment diagrams may be displayed on the tension side
(Brazilian convention) or on the compression side (common U.S.A.
convention) of the members. Use the File → Sign
Convention menu to select the "tension" or
"compression" convention for the plotting of bending moment
diagrams. When adopting the tension side option, positive bending
moments are displayed on the bottom side; and, when adopting the
compression side option, positive bending moments are displayed on the
top side.

- Plotting Influence Lines
Influence Lines of internal forces in the selected sections follow the sign
convention explained above. The standard for plotting influence lines can be
defined in the sign convention sub-menu. There are two options: Plot
positive influence line values on the bottom side of member, or
influence line plot convention follows corresponding internal force
diagram convention.
- Plotting Envelopes:
Each internal force and moment envelope follows the sign convention defined
above for the corresponding diagram.
The internal force diagrams, deformed configuration, influence
lines, and envelopes have a default initial scale on the screen to create a
reasonable image. This scale can be modified using the slider bar at the left
of buttons of the Results toolbars. Use the slider bar to modify the
scaling of displayed diagrams as desired.
The scaling of the results may also be adjusted by the user editing its
value on a text box in the top toolbar, between the load attribute buttons and
the result scale slide. In Diagram and Load-train Envelope
modes, the result scale factor is defined in terms of units of the
corresponding internal force per unit of length. In the deformed
configuration, the scale factor is a displacement amplification factor
(Deformed Factor). In influence lines, the scale factor is an
adimensional parameter that controls the influence line display scale in
relation to the model.
The images on the following sections highlight the text box on the graphics
interface that is used to edit the result scale factor and the buttons that
are used to obtain the desired result visualization.
| Deformed configuration |
 |
| Axial force diagram |
Shear force diagram |
Bending moment diagram |
 |
 |
 |
| Axial force influence line |
Shear force influence line |
Bending moment influence line |
 |
 |
 |
| Axial force load-train envelopes |
Shear force load-train envelopes |
Bending moment load-train envelopes |
 |
 |
 |
In Diagram mode, clicking a point on a member with the mouse left
button displays the value of the corresponding diagram for that point in the
top message bar above the drawing area. In this mode, clicking a node with the
mouse right button displays result information, such as displacements,
rotation, or reaction forces, related to the selected node in the right-most
area of the screen.
In Influence Line mode, if the option to select a new cross-section
is NOT active, clicking a point on a member with the mouse left button
displays the value of the corresponding influence line in the top message
bar.
In Load-train Envelope mode, the minimum and maximum envelope values
at the selected point are display in the top message bar.
In all the modes, if the right button of mouse is used, additional
information related to the selected member results appears in the right-most
area of the screen. If a step for the displayed result is defined through the
Step Values option in the Display menu (see
Visualization Controls - The Display
Menu), the step results of the diagram for the selected member will
be shown in this area.
The image below shows an example of the visualization of a bending moment
diagram with step values indicated in the display and in the lateral area
for the selected member.