![]()
|
|
|
The following source code can be used to start the development of XY application.
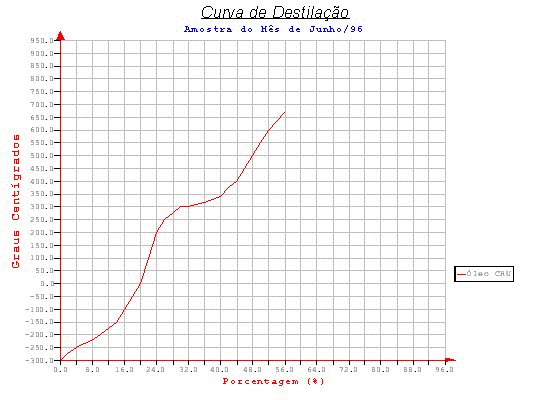
The aim of the test program is to draw the graph below.

Remark: In this application, the IUP widget toolkit will be used only
to offer menus, buttons and canvases. The IUP canvas will be associated to a CD
device, where the graph will be drawn.
As a start, programmers should declare que include files needed.
#include "iup.h" // IUP #include "cd.h" // CD #include "cdiup.h" // IUP + CD #include "xy.h" // XY #include "xyserfil.h" // my own series |
To define the titles, just declare two text objects:
XYText tipo_de_curva(
         "Curva de Destilação",
         XY_BLACK,
         XYText::large,
         XYText::helvetica,
         XYText::italic,
         XYText::north,
         XYText::horizontal,
         xytrue);

XYText periodo(
         "Amostra do Mês de Junho/96",
         XY_BLUE,
         XYText::standard,
         XYText::timesRoman,
         XYText::bold,
         XYText::north,
         XYText::horizontal);
|
Then, the axes should be declared (linear). Note that some definitions should be made before! They correspond to the axes' titles and decorator scales.
| The titles are text objects (just like stated before). | |
| The decorators specify the numeric, date/time or string format associated to values.As the decorators refer to string transformation, it should be associated to a scale text object. So, these text objects should be defined before! |
// Defining text scales...
XYText escala_porcentagem(
       XY_BLACK,
       XYText::small,
       XYText::timesRoman,
       XYText::plain,
       XYText::north,
       XYText::horizontal);

XYText escala_temperatura(
       XY_BLACK,
       XYText::small,
       XYText::timesRoman,
       XYText::plain,
       XYText::east,
       XYText::horizontal);
// Defining scales... (0.1 precision)
XYNumericalScaleDecorator decorador_porcentagem(
       "%.1f", &escala_porcentagem);
XYNumericalScaleDecorator decorador_temperatura(
       "%.1f", &escala_temperatura);
// Defining titles...
XYText tit_porcentagem (
        "Porcentagem (%)",
        0.5, 0.15,
        XY_RED,
        XYText::standard,
        XYText::timesRoman,
        XYText::plain,
        XYText::center,
        XYText::horizontal);

XYText tit_temperatura (
        "Graus Centígrados",
        0.03, 0.5,
        XY_RED,
        XYText::standard,
        XYText::timesRoman,
        XYText::plain,
        XYText::center,
        XYText::vertBotTop);
// Finally, defining axes...
XYLinearAxis eixo_porcentagem(
        0.0, 96.0,
        0.11, 0.2,
        XY_RED,
        0.7,
        0.0,
        4.,
        &decorator_porcentagem,
        &tit_porcentagem);

XYLinearAxis eixo_temperatura(
        -300, 950,
        0.11, 0.2,
        XY_RED,
        0.6,
        90.0,
        50.,
        &decorator_temperatura,
        &tit_temperatura);
|
Then, the programmer can set two grid objects that will be plot inside the graph. Each grid is associated to one direction (horizontal or vertical).
XYGrid grv ( 0., 96., 0., XY_GRAY, 0., 4.); XYGrid grh (-300., 950., -300., XY_GRAY, 90., 50.); |
After the axes definition, the new curve can be assingned to them. This definition is divided in two parts:
| series definition - a XYSerie object should be created. This object provides the data set. | |
| mask definition - the data representation (lines, marks etc). |
In our example, the data set is represented by the variable arquivo, provided by the class XYSeriesFile. Check others tutorial sections fo detailed explanation on how building application series.
// this object will ready the content of "dado.dat" file
XYSeriesFile arquivo ("dado.dat");
|
For this application, a simple line mask is set with three attributes: a title, a series and two axes.
| The title is a common text object (created for this purpose). This text is used at the graph legend. | |
| The series is the arquivo variable. | |
| The axes were already described before. |
// Defining the curve title...
XYText mask_titulo(
          "Óleo CRU",
          XY_BLACK,
          XYText::tile,
          XYText::timesRoman,
          XYText::plain,
          XYText::north,
          XYText::horizontal);
// Defining line mask
XYCartesianLineMask marquivo(
          &mask_titulo,                         // title
          &arquivo,                             // series
          &eixo_porcentagem, &eixo_temperatura, // axes
          XY_RED,
          1,
          XYCartesianLineMask::continuous);
|
A legend can construted with a simple constructor.
XYLegend legend (0.83, 0.3, 1, 1); |
At last, the graph can be defined. This time, the constructor is called inside the main function. Then, the following declaration builds only a pointer.
XYCartesian* grafico = NULL; |
After the graph construction, a special redraw callback should be set to force a graph repaint when the IUP/CD canvas is exposed. The following function uses the IUP callback paradigm: It clears and redraw the graph.
int frepaint (Ihandle *) {
   grafico->clear();
   grafico->draw();
   return IUP_DEFAULT;
}
|
void main(void){
   // Initializing IUP anda building a simple dialog...
   IupOpen ();
   Ihandle *c = IupCanvas ("arepaint");
   Ihandle *d = IupDialog (c);
   IupSetAttributes (d," SIZE = 400x300, TITLE = XY++");
   IupSetFunction ("arepaint", (Icallback) frepaint);
   IupMap(d);

   // Constructing the graph:
   // Association to "c": the IUP canvas
   // Assoctiation to the grids declared before
   grafico = new XYCartesian (c, 0.0, 0.0, 1.0, 1.0, &grv, &grh);

   // Setting titles...
   grafico->insert (&período);
   grafico->insert (&tipo_de_curva);

   // Setting colors...
   grafico->color (XY_GRAY);

   // Inserting axes...
   grafico->insert (&eixo_temperatura);
   grafico->insert (&eixo_porcentagem);

   // Calculating the mask area (after the axes definition and insertion)
   grafico->calcMaskArea (0);

   // Setting mask area color
   grafico->maskAreaColor (XY_WHITE);

   // Inserting the curve (mask).
   // Remember: the mask is already associated to a constructed series (arquivo)
   grafico->insert (&marquivo);

   // Defining the legend...
   grafico->legend (&legend);

   // IUP call: exposing the main dialog ("d")...
   // Entering IUP event loop. If the loop ends, the application is down!
   IupShow (d);
   IupMainLoop ();
   IupClose ();
}
|