![]()
Graphical Paradigm
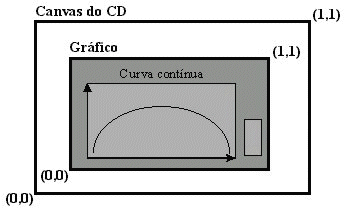
Any any CD canvas can be the place where the result is plot, consider the following example:

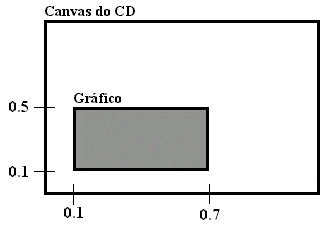
The graph area is set by normalized coordinate system (related to CD canvas). As an example, consider that the graph area is set with the following values: xmin = 0.1, ymin = 0.1, xmax = 0.7 and ymax = 0.5. The result is like the figure below.

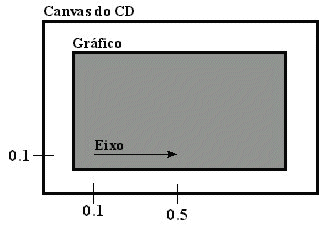
The position and size of texts, axes, markers and legends are all normalized to tha global graph area. That is, if the axis attributes are set as: x = 0.1, y = 0.1 and size = 0.4, the axis' position should be like:

The region where the mask are drawn is called the mask area. It is implicity calculated based on the axes position.