Creates a plot of one or more data sets. It inherits from IupCanvas. Uses the MathGL library.
MathGL is a library for creating plots that is system independent. It is maintained by Alexey Balakin and available at SourceForge http://mathgl.sourceforge.net/ with GPL and LGPL licenses.
IupMglPlot library includes the MathGL 2.3.5 source code, so no external references are needed, but contains only the LGPL part of the library.
The IupMglPlotOpen function must be called after a IupOpen, so that the control can be used. The "iup_mglplot.h" file must also be included in the source code. The program must be linked to the controls library (iup_mglplot), and with the OpenGL library.
To make the control available in Lua use require"iuplua_mglplot" or manually call the initialization function in C, iupmglplotlua_open, after calling iuplua_open. When manually calling the function the iuplua_mglplot.h file must also be included in the source code and the program must be linked to the Lua control library (iuplua_mglplot).
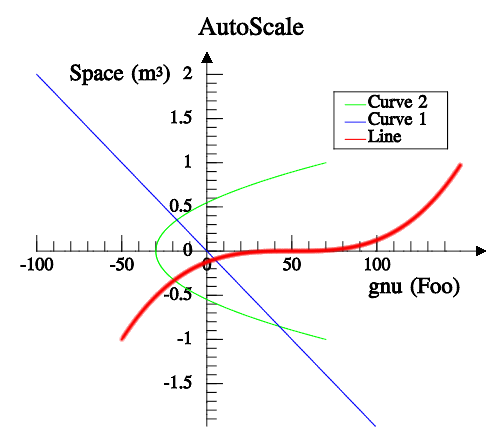
Each plot can contain 2 or 3 axes (X and Y and/or Z), a title, a legend box, a colorbar, a grid, a dataset area and as many datasets you want.
Each dataset is added using the Auxiliary Functions. All other plot parameters are configured by attributes.
If no attribute is set, the default values were selected to best display the plot.
IMPORTANT: When setting attributes the plot is NOT redrawn until the REDRAW attribute is set or a redraw event occurs.
The dataset area is delimited by the min/max axis attributes. Data is only plotted inside the dataset area. This area defines the 2D or 3D plot coordinate space. The screen area is a 2D pixels coordinate space. And finally the dataset also defines a normalized space, that means min/max is converted to 0-1.
The legend box is a list of the dataset names, each one drawn with the same color of the correspondent dataset. The box is located in one of the four corners of the dataset area.
The colorbar is an additional axis showing the the colors used to pseudo color the data for some plot modes.
The grid is automatically spaced accordingly the current axis displayed values.
The title is always centered in the top of the plot.
The axes are positioned at the origin (0,0,0), but can be automatically positioned at the left-bottom. If values are only positive then the origin will be placed in left bottom position. If values are negative and positive then origin will be placed inside the plot. The ticks in the axis are also automatically distributed.
MathGL supports several kinds of data. IupMglPlot restricts this to a few combinations. First there are 3 major classes:
Linear sequential data are simply a sequence of points whether in 1D ([y1],[y2],...), 2D ([x1,y1],[x2,y2],...) or 3D ([x1,y1,z1],[x2,y2,z2],...) coordinates.
Planar data is a bi-dimensional array of values, just like a digital image. Each value is f(x,y), where x belongs to [AXS_XMIN, AXS_XMAX] and y to [AXS_YMIN, AXS_YMAX].
Volumetric data is a tri-dimensional array of values, that represents a 3D volume. Each value is f(x,y,z), where x belongs to [AXS_XMIN, AXS_XMAX] and y to [AXS_YMIN, AXS_YMAX] and z to [AXS_ZMIN, AXS_ZMAX].
Linear data is the same representation accepted by IupPlot, with the addition that IupMglPlot has support for 3D coordinates. When plotting linear 1D data the automatic range will be XMIN=0 and XMAX=count-1.
Planar and volumetric data can be very memory consuming, so be careful when using them. Planar and volumetric data in IupMglPlot have x, y and z coordinates equidistantly distributed. Planar and volumetric data are stored in a 1D dataset created by IupMglPlotNewDataSet, and filled with IupMglPlotSetData, IupMglPlotLoadData or IupMglPlotSetFromFormula functions only.
Zoom and Pan operations can be done using keyboard or mouse actions in 2D and 3D plots.
Zoom can be done using the mouse wheel (Zoom in: scroll down; Zoom out: scroll up), the Ctrl+Left mouse button pressed and vertical mouse movements (Zoom in: bottom-up; Zoom out: top-down) or the plus '+' (Zoom in) and minus '−' (Zoom out) keys.
Pan is done using horizontal and vertical mouse movements with the left mouse button pressed. By keyboard, the Ctrl+arrow keys combinations can be used to shift the window. Arrow keys can also be used without using the Ctrl key to slower movements.
Rotation operations can also be done using keyboard or mouse actions, but only for 3D plots.
The interaction can be reset with a mouse double-click inside the plot area or by pressing the HOME key. This action restores the plot to the default view (no zoom, no pan and no rotation).
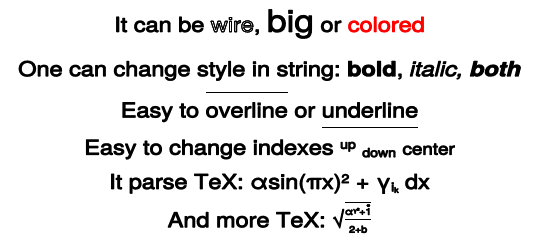
MathGL provides support for parsing LaTeX-like syntax. So all labels and title can contain formatting commands and equation symbols. For example: \b (bold), \i (italic), \u (underline), \big (bigger size), @ (smaller size), ^ (upper), _ (lower), etc. The full list contain approximately 2000 commands. Multiline text is accepted.
For example:
"It can be \\wire{wire}, \\big{big} or #r{colored}"
"One can change style in string: " "\\b{bold}, \\i{italic, \\b{both}}"
"Easy to \\a{overline} or \\u{underline}"
"Easy to change indexes ^{up} _{down} @{center}"
"It parse TeX: \\int \\alpha \\cdot \\sqrt3{sin(\\pi x)^2 + \\gamma_{i_k}} dx"
"\\sqrt{\\frac{\\alpha^{\\gamma^2}+" "\\overset 1{\\big\\infty}}{\\sqrt3{2+b}}}"
Ihandle* IupMglPlot(void); [in C]
iup.mglplot{} -> (ih: ihandle) [in Lua]
mglplot() [in LED]
This function returns the identifier of the created plot, or NULL if an error occurs.
void IupMglPlotBegin(Ihandle* ih, int dim); [in C]
iup.MglPlotBegin(ih: ihandle, dim: number) [in Lua]
ih:Begin(dim: number) [in Lua]
Prepares a dataset to receive samples. The dimension of the data can be 1, 2 or 3. Linear data only.
void IupMglPlotAdd1D(Ihandle* ih, const char* name, double y); [in C]
iup.MglPlotAdd1D(ih: ihandle, name: string, y: number) [in Lua]
ih:Add1D(name: string, y: number) [in Lua]
Adds a sample to the dataset. Can only be called if IupMglPlotBegin was called with dim=1. name is an optional string used for tick labels in the X axis, and it can be NULL (nil in Lua). Names are allowed only for the first dataset and when set ticks configuration for the X axis is ignored, all the names are shown. The X axis data is automatically generated (0,1,2,3,...). Linear data only.
void IupMglPlotAdd2D(Ihandle* ih, double x, double y); [in C]
iup.MglPlotAdd2D(ih: ihandle, x, y: number) [in Lua]
ih:Add2D(x, y: number) [in Lua]
Adds a sample to the dataset. Can only be called if IupMglPlotBegin was called with dim=2. Linear data only.
void IupMglPlotAdd3D(Ihandle* ih, double x, double y, double z); [in C]
iup.MglPlotAdd3D(ih: ihandle, x, y, z: number) [in Lua]
ih:Add3D(x, y, z: number) [in Lua]
Adds a sample to the dataset. Can only be called if IupMglPlotBegin was called with dim=3. Linear data only.
int IupMglPlotEnd(Ihandle* ih); [in C]
iup.MglPlotEnd(ih: ihandle) -> (index: number) [in Lua]
ih:End() -> (index: number) [in Lua]
Adds the dataset to the plot and returns the dataset index. The dataset can be empty. Redraw is NOT done until the REDRAW attribute is set. Also it will change the current dataset index (CURRENT) to the return value. You can only set attributes of a dataset AFTER you added the dataset. Can only be called if IupMglPlotBegin was called. Whenever you create a dataset all its "DS_*" attributes will be set to the default values. Notice that DS_MODE must be set before other "DS_*" attributes. Linear data only.
void IupMglPlotNewDataSet(Ihandle* ih, int dim); [in C]
iup.MglPlotNewDataSet(ih: ihandle, dim: number) [in Lua]
ih:NewDataSet(dim: number) [in Lua]
Creates an empty dataset to receive samples. The dimension of the data can be 1, 2 or 3. Linear data can have 1, 2 or 3 dimensions. Planar data has 2 dimensions, but use dim=1. Volumetric data has 3 dimensions, but use dim=1.
Planar and volumetric data distribute their data in 2D and 3D continuous arrays, so the number of dimensions is given only when the array is set in IupMglPlotSetData, IupMglPlotLoadData or IupMglPlotSetFromFormula. You can convert planar data into linear data using the DS_REARRANGE and DS_SPLIT attributes.
void IupMglPlotInsert1D(Ihandle *ih, int ds_index, int sample_index, const char** names, double* y, int count); [in C]
void IupMglPlotInsert2D(Ihandle *ih, int ds_index, int sample_index, double* x, double* y, int count);
void IupMglPlotInsert3D(Ihandle *ih, int ds_index, int sample_index, double* x, double* y, double* z, int count);
iup.IupMglPlotInsert1D(ih: ihandle, ds_index, sample_index: number, names: table of string, y: table of number) [in Lua]
iup.IupMglPlotInsert2D(ih: ihandle, ds_index, sample_index: number, x, y: table of number)
iup.IupMglPlotInsert3D(ih: ihandle, ds_index, sample_index: number, x, y, z: table of number)
ih:Insert1D(ds_index, sample_index: number, names: table of string, y: table of number) [in Lua]
ih:Insert2D(ds_index, sample_index: number, x, y: table of number)
ih:Insert3D(ds_index, sample_index: number, x, y, z: table of number)
Inserts an array of samples in the dataset ds_index at the given sample_index. Can be used only after the dataset is added to the plot. sample_index can be after the last sample so data is appended to the array. Current data is shifted if necessary. names are optional strings used for tick labels in the X axis, and it can be NULL (nil in Lua). Names are allowed only for the first dataset and when set ticks configuration for the X axis is ignored, all the names are shown. Also for the 1D version, the X axis data is automatically generated (0,1,2,3,...). Linear data only.
void IupMglPlotSet1D(Ihandle *ih, int ds_index, const char** names, double* y, int count); [in C]
void IupMglPlotSet2D(Ihandle *ih, int ds_index, double* x, double* y, int count);
void IupMglPlotSet3D(Ihandle *ih, int ds_index, double* x, double* y, double* z, int count);
iup.IupMglPlotSet1D(ih: ihandle, ds_index: number, names: table of string, y: table of number) [in Lua]
iup.IupMglPlotSet2D(ih: ihandle, ds_index: number, x, y: table of number)
iup.IupMglPlotSet3D(ih: ihandle, ds_index: number, x, y, z: table of number)
ih:Set1D(ds_index: number, names: table of string, y: table of number) [in Lua]
ih:Set2D(ds_index: number, x, y: table of number)
ih:Set3D(ds_index: number, x, y, z: table of number)
Sets an array of samples in the dataset ds_index. Existing data is removed. Can be used only after the dataset is added to the plot. names is an optional array of strings used for tick labels in the X axis, and it can be NULL (nil in Lua). Names are allowed only for the first dataset and when set ticks configuration for the X axis is ignored, all the names are shown. Also for the 1D version, the X axis data is automatically generated (0,1,2,3,...). Linear data only.
void IupMglPlotSetFormula(Ihandle* ih, int ds_index, const char* formulaX, const char* formulaY, const char* formulaZ, int count);
iup.MglPlotSetFormula(ih: ihandle, ds_index: number, formulaX, formulaY, formulaZ: string, count: number);
ih:SetFormula(ds_index: number, formulaX, formulaY, formulaZ: string, count: number);
Same as IupMglPlotSet* but data is generated from a formula. If count is 0 the current size is used. If 2D data then formulaY must be non NULL. If 3D data then formulaZ must be non NULL. The variables of the formulas must be x, y and/or z. Coordinates are evaluated in the [AXS_?MIN, AXS_?MAX] interval. There is no difference between lower or upper case in formulas. Linear data only.
The operators and functions can be:
+ - * / ^      ('^' is 'integer power')
< > = & |      (logical operators, '&' is 'and', '|' is 'or')
sqrt(a)  pow(a,b)  log(a,b)  ln(a)    lg(a)            (ln(a)=log(e,a)  lg(a)=log(10,a)
abs(a)   sign(a)   mod(a,b)  step(a)  int(a)   rnd      pi
sin(a)   cos(a)    tan(a)    asin(a)  acos(a)  atan(a)
sinh(a)   cosh(a)  tanh(a)   asinh(a) acosh(a) atanh(a)
void IupMglPlotSetData(Ihandle *ih, int ds_index, double* data, int count_x, int count_y, int count_z); [in C]
iup.MglPlotSetData(ih: ihandle, ds_index: number, data: table of number) [in Lua]
ih:SetData(ds_index: number, data: table of number) [in Lua]
Sets an array of samples in the dataset ds_index. All previous values are removed. Can be used only after a 1D dataset is added to the plot, the actual dimension will be defined by the count_* parameters. If count_y is greater than 1 the data will be Planar (like a raster 2D image), if count_z is also greater than 1 the data will be Volumetric (a 3D volume).
Notice that when count_y and/or count_z are greater than 0 a large amount of memory is used. All previous functions create linear data (a sequence of points) even though their coordinates can have 1, 2 or 3 dimensions. The data should be arranged so the element (x0, y0, z0) is accessed using the position [x0 + count_x*y0 + count_x*count_y*z0].
DS_COUNT is set to count_x*count_x*count_y. Existing data is removed.
Can be used for linear, planar or volumetric data, but linear data is limited to 1D coordinates. You can convert planar data into linear data using the DS_REARRANGE and DS_SPLIT attributes.
void IupMglPlotLoadData(Ihandle *ih, int ds_index, const char* filename, int count_x, int count_y, int count_z); [in C]
iup.MglPlotLoadData(ih: ihandle, ds_index: number, filename: string[, count_x, count_y, count_z: number]) [in Lua]
ih:LoadData(ds_index: number, filename: string[, count_x, count_y, count_z: number]) [in Lua]
Same as IupMglPlotSetData but loads the data from a file. The file must contains space (' ') separated numeric data in text format. The text can contains line comments starting with '#'.
DS_COUNT is set to count_x*count_x*count_y. Existing data is removed. Linear data is limited to 1D coordinates.
If any count_* is 0 all their values are automatically calculated. The number of elements in the first line defines count_x, the number of lines before an empty line or before a form feed ('\f') defines count_y, and the number of empty lines or the number of form feeds ('\f') defines count_z.
Can be used for linear, planar or volumetric data, but linear data is limited to 1D coordinates. You can convert planar data into linear data using the DS_REARRANGE and DS_SPLIT attributes.
void IupMglPlotSetFromFormula(Ihandle *ih, nt ds_index, const char* formula, int count_x, int count_y, int count_z)); [in C]
iup.MglPlotSetFromFormula(ih: ihandle, ds_index: number, formula: string[, count_x, count_y, count_z: number]) [in Lua]
ih:SetFromFormula(ds_index: number, formula: string[, count_x, count_y, count_z: number]) [in Lua]
Same as IupMglPlotSetData but data is generated from a formula. If all count_* are 0 the current size remains, and the existing data is preserved but overwritten if the formula results that. If any count_* is NOT zero then the existing data size is removed. The variables of the formulas must be 'x', 'y' and/or 'z'. Coordinates are evaluated in the [AXS_?MIN, AXS_?MAX] interval. There is no difference between lower or upper case in formulas. The operators and functions can be:
+ - * / ^      ('^' is 'integer power')
< > = & |      (logical operators, '&' is 'and', '|' is 'or')
sqrt(a)  pow(a,b)  log(a,b)  ln(a)    lg(a)            (ln(a)=log(e,a)  lg(a)=log(10,a)
abs(a)   sign(a)   mod(a,b)  step(a)  int(a)   rnd      pi
sin(a)   cos(a)    tan(a)    asin(a)  acos(a)  atan(a)
sinh(a)   cosh(a)  tanh(a)   asinh(a) acosh(a) atanh(a)
DS_COUNT is set to count_x*count_x*count_y.
Can be used for linear, planar or volumetric data, but linear data is limited to 1D coordinates. You can convert planar data into linear data using the DS_REARRANGE and DS_SPLIT attributes.
void IupMglPlotTransform(Ihandle* ih, double x, double y, double z, int *ix, int *iy); [in C]
iup.MglPlotTransform(ih: ihandle, x, y, z: number) -> (ix, iy: number) [in Lua]
ih:Transform(x, y, z: number) -> (ix, iy: number) [in Lua]
Converts coordinates from plot coordinates to pixels. It can be used only inside PREDRAW_CB and POSTDRAW_CB callbacks. Output variables can be NULL if not used.
void IupMglPlotTransformTo(Ihandle* ih, int ix, int iy, double *x, double *y, double *z); [in C]
iup.MglPlotTransformTo(ih: ihandle, ix, iy: number) -> (x, y, z: number) [in Lua]
ih:TransformTo(ix, iy: number) -> (x, y, z: number) [in Lua]
Converts coordinates from pixels to plot coordinates. It can be used only inside PREDRAW_CB and POSTDRAW_CB callbacks. Output variables can be NULL if not used.
void IupMglPlotDrawMark(Ihandle* ih, double x, double y, double z); [in C]
iup.MglPlotDrawMark(ih: ihandle, x, y, z: number) [in Lua]
ih:DrawMark(x, y, z: number) [in Lua]
Draws a mark at given position in plot coordinates. It can be used only inside PREDRAW_CB and POSTDRAW_CB callbacks. The attributes DRAWCOLOR, DRAWMARKSTYLE and DRAWMARKSIZE can be used to control mark appearance.
void IupMglPlotDrawLine(Ihandle* ih, double x1, double y1, double z1, double x2, double y2, double z2); [in C]
iup.MglPlotDrawLine(ih: ihandle, x1, y1, z1, x2, y2, z2: number) [in Lua]
ih:DrawLine(x1, y1, z1, x2, y2, z2: number) [in Lua]
Draws a line from position 1 to position 2 in plot coordinates. It can be used only inside PREDRAW_CB and POSTDRAW_CB callbacks. The attributes DRAWCOLOR, DRAWLINESTYLE and DRAWLINEWIDTH can be used to control line appearance.
void IupMglPlotDrawText(Ihandle* ih, const char* text, double x, double y, double z); [in C]
iup.MglPlotDrawText(ih: ihandle, text: string, x, y, z: number) [in Lua]
ih:DrawText(text: string, x, y, z: number) [in Lua]
Draws a text at given position in plot coordinates. It can be used only inside PREDRAW_CB and POSTDRAW_CB callbacks. The attributes DRAWCOLOR, DRAWFONT, DRAWFONTSTYLE and DRAWFONTSIZE (a factor) can be used to control text appearance. DRAWFONTSTYLE can be a combination of Plain (Regular), Bold, Italic (Oblique), Wired, Underline, Strikeout, Left, Center and Right.
void IupMglPlotPaintTo(Ihandle* ih, const char* format, int w, int h, double dpi, void* data); [in C]
iup.MglPlotPaintTo(ih: ihandle, format: string, w, h, dpi:number, data: string or lightuserdata) [in Lua]
ih:PaintTo(format: string, w, h, dpi:number, data: string or lightuserdata) [in Lua]
Plots to a metafile or a bitmap instead of the display canvas. format will define the interpretation of the data parameter. format can be: "EPS", "SVG", "RGB", or "RGBA". When format is EPS or SVG, data is a filename string. When format is RGB or RGBA data is the image buffer where the pixels will be copied, must be already allocated. w and h is the size in pixels, and dpi is the resolution in dots or pixels per inch. If w, h or dpi are 0 the screen equivalent is used.
ALPHA (non inheritable): Alpha value for overall transparency. Used only when TRANSPARENT=Yes. Default: 0.5
ANTIALIAS (non inheritable): Enable or disable the anti-aliasing support when in OpenGL. Ignored when OPENGL=NO. Default: Yes. When enabled text has a much better rendering, but 3D graphs will not process depth properly.
BGCOLOR: the background color. Default: "255 255 255".
ERRORMESSAGE (read-only)(non inheritable): If not NULL returns the last error message reported by MathGL.
SUPPRESSWARNING (write-only)(non inheritable): Suppress de print of warning messages in stderr. Can be Yes or No. Default: No. (since 3.21)
FONT: the default font used in all text elements of the plot: title, legend and labels. Font support is done using custom font files in MathGL font format (*.vfm). The font file must be located in the path pointed by the "IUP_MGLFONTS" environment variable, or in the path pointed by the "MGLFONTS" global attribute. The font name will be automatically combined with the path to compose a file name. If the font load fail, an internal MathGL font is used. Font loading is a very slow process in MathGL. TrueType (*.ttf) and OpenType (*.otf) font files support removed in version 3.11.
All *FONTSTYLE attributes can have a
combination of the following styles: Plain (Regular), Bold, Italic (Oblique),
Wired, Underline, Strikeout, Left, Center and Right.
All *FONTSIZE
attributes are actually a factor that multiplies the size defined by the FONT
attribute and an internal MathGL factor. So the actual size will be
fontsize_factor * internal_factor * font_size.
FGCOLOR: the default color used in all text elements of the plot: title, legend and labels. Default: "0 0 0 255".
All color values can have an optional alpha value. Hexadecimal format is also accepted.
MARGINLEFT, MARGINRIGHT, MARGINTOP, MARGINBOTTOM (non inheritable): internal MathGL margin configuration of the dataset area. Can be Yes or No. Default: "Yes". (since 3.11)
MGLGRAPH (read-only)(non inheritable): returns the mglGraph* handle used internally. (since 3.11)
OPENGL (non inheritable): Enable or disable the rendering in OpenGL. Default: No. When NO the rendering is slower, but when Yes some features does not behave as expected. See Known Issues.
REDRAW (write-only)(non inheritable): redraw the plot and update the display. Value is ignored. All other attributes will NOT update the display, so you can set many attributes without visual output. If the element is redraw by the system because of a redraw event or by a call to IupUpdate, it will have the same effect as if REDRAW was set.
RESET (write-only) (non inheritable): restores all attributes to their default values. Value is ignored.
TRANSPARENT (non inheritable): Enable or disable the transparency support. Default: No.
ROTATE (non inheritable): define the angles of the axis rotation in degrees for 3D plots. The format is "angleX:angleY:angleZ". As example, the "0.0:90:0.0" rotates the Y-axis plot in 90 degrees. Partial values are also accepted, like "60::−45" or "::30" or "120". Default: 0:0:0.
ZOOM (non inheritable): define the zoom to 2D and 3D plots. The format is "x1:y1:x2:y2" in normalized coordinates, limited to the interval [0-1]. As example, the "0:0:1:1" set a plot to default view (centered in the drawing area). Partial values are also accepted, like "0.2:0.2" or ":0.3::1.3" or "−0.4". If values are set only to x1 and/or x2 coordinates, the zoom is restricted to the X axis. On the other hand, if values are set only to y1 and/or y2 coordinates, the zoom is restricted to the Y axis. Default: 0:0:1:1
TITLE (non inheritable): the title. Located always at the top center area.
TITLECOLOR: title color. Default: FGCOLOR.
TITLEFONTSIZE: title font size factor. Default: 1.0. The internal MathGL factor is 2.0.
TITLEFONTSTYLE: title font style.
LEGEND: shows or hides the legend box. Can be YES or NO. Default: NO. LEGENDSHOW is also accepted.
LEGENDBOX: draws a box around the legend area. Default: YES.
LEGENDCOLOR: title color. Default: FGCOLOR.
LEGENDFONTSIZE: legend font size factor. Default: 1.0. The internal MathGL factor is 0.8.
LEGENDFONTSTYLE: legend font style.
LEGENDPOS: legend box position. Can be: "TOPLEFT", "TOPRIGHT", "BOTTOMLEFT", or "BOTTOMRIGHT. Default: "TOPRIGHT".
COLORBAR: shows or hides the colorbar. Can be YES or NO. Default: NO.
COLORBARPOS: colorbar position. Can be: "LEFT, "TOP", "RIGHT", "BOTTOM". Default: "RIGHT".
COLORBARRANGE: interval of data values used for pseudo coloring in some plot modes. Must be "min:max" ("%g:%g in C). Default from AXS_?MIN to AXS_?MAX according to COLORBARAXISTICKS.
COLORBARAXISTICKS: axis used as reference for colorbar ticks. Default: Z
GRID: shows or hides the grid in both or a specific axis. Can be: XYZ (YES), X, Y, Z, XY, XZ, YZ or NO. Default: NO. The values HORIZONTAL (Y) and X (VERTICAL) are accepted for IupPlot compatibility.
GRIDCOLOR: grid color. Default: "200 200 200".
GRIDLINESTYLE: line style of the grid. Can be: "CONTINUOUS", "DASHED", "DOTTED", "DASH_DOT", "DASH_DOT_DOT". Default is "CONTINUOUS".
BOX: draws a bounding box around the dataset area. Default: NO.
BOXTICKS: if BOX=Yes then major ticks are also drawn along the box. Default: YES.
BOXCOLOR: box color. Default: FGCOLOR.
CLEAR (write-only): removes all datasets. Value is ignored.
COUNT (read-only): total number of datasets.
CURRENT: current dataset index. Default is -1. When a dataset is added it becomes the current dataset. The index starts at 0. All "DS_*" attributes are dependent on this value.
REMOVE (write-only): removes a dataset given its index.
DS_COLOR: color of the current dataset and it legend text. Default is dynamically generated for the 6 first datasets, others are default to black "0 0 0". The first 6 are: 0="255 0 0", 1="0 0 255", 2="0 255 0", 3="0 255 255", 4="255 0 255", 5="255 255 0".
DS_COUNT (read-only): returns the number of samples of the current dataset. For planar or volumetric datasets returns count_x * count_y * count_z.
DS_DIMENSION (read-only): returns the number of dimensions of the data: 1, 2 or 3. For planar and volumetric datasets returns the actual size of each dimension "<count_x>x<count_y>x<count_y>", for example "600x400x1" (planar) or "512x512x512" (volumetric).
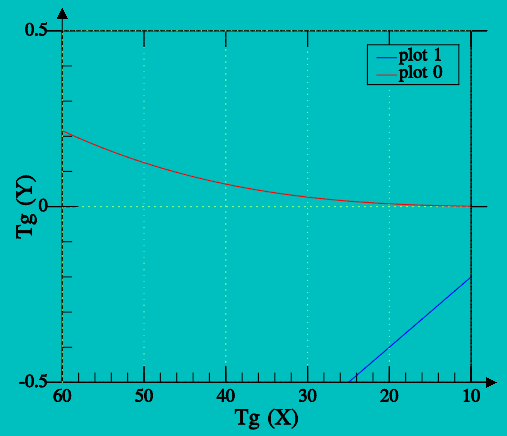
DS_LEGEND: legend text of the current dataset. Default is dynamically generated: "plot 0", "plot 1", "plot 2", ...
DS_LINESTYLE: line style of the current dataset. Can be: "CONTINUOUS" (or "SOLID"), "LONGDASHED", "DASHED", "SMALLDASHED", "DOTTED", "DASH_DOT", "SMALLDASH_DOT". Default is "CONTINUOUS".
DS_LINEWIDTH: line width of the current dataset. Default: 1. Can be 1 to 9 (since 3.11).
DS_MARKSTYLE: mark style of the current dataset. Can be: "PLUS", "STAR", "CIRCLE", "X", "BOX", "DIAMOND", "HOLLOW_CIRCLE", "HOLLOW_BOX", "HOLLOW_DIAMOND", "DOT", "ARROW_UP", "ARROW_LEFT", "ARROW_DOWN", "ARROW_RIGHT". Default is "X".
DS_MARKSIZE: mark size of the current dataset in normalized coordinates. Default: 1.0.
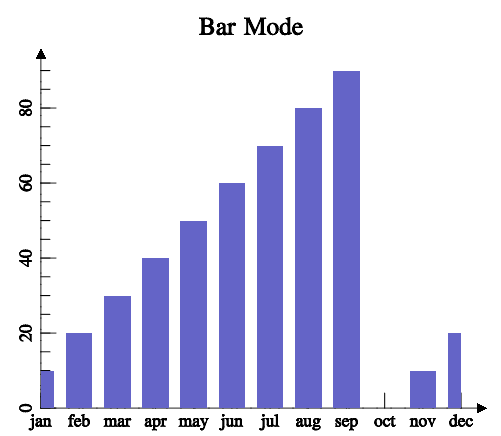
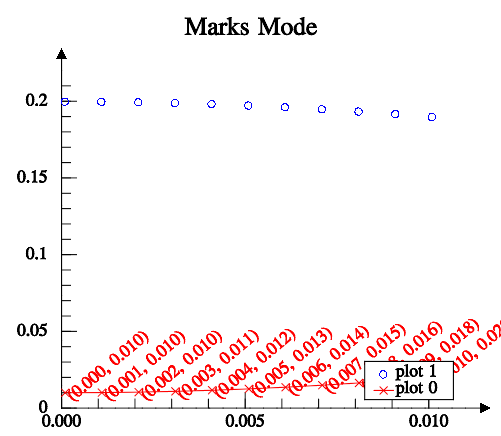
DS_MODE: drawing mode of the current dataset. Default: "LINE".
Can be: LINE, BAR, MARK, MARKLINE, RADAR, AREA, BARHORIZONTAL, CHART, STEP or STEM for linear datasets.
Can be: PLANAR_MESH, PLANAR_FALL, PLANAR_BELT, PLANAR_SURFACE, PLANAR_BOXES, PLANAR_TILE, PLANAR_DENSITY, PLANAR_CONTOUR, PLANAR_AXIALCONTOUR or PLANAR_GRADIENTLINES for planar datasets.
Can be: VOLUME_ISOSURFACE, VOLUME_DENSITY, VOLUME_CONTOUR or VOLUME_CLOUD for volumetric datasets.
Each of these modes can have secondary attributes, that can be configured only for the plot, and not for a specific dataset. See more at DS_MODE Options.
DS_REARRANGE (write-only): rearrange planar data into linear data. Value is ignored. It can rearrange planar data with count_y=2 or count_y=3, into 2D or 3D linear data accordingly. It can also rearrange planar data with count_y!=1 and count_x=2 or count_x=3 into 2D or 3D linear data accordingly.
DS_SPLIT (write-only): rearrange planar data into linear data, but spliting into different datasets. It can rearrange planar data with count_y=2 or count_y=3, into 2 or 3 datasets of 1D linear data accordingly. The current dataset is modified and 1 or 2 new datasets are created accordingly.
DS_SHOWVALUES: enable or disable the display of the values near each sample. Can be YES or NO. Default: NO. Values are drawn with LEGENDFONTSIZE and LEGENDFONTSTYLE.
DS_REMOVE (write-only): removes a sample from the current dataset given its index. It can specify a range of samples using "index:count" (%d:%d). Ignored for planar and volumetric datasets.
AXS_?: enable or disable the axis display. Can be YES or NO. Default: YES.
AXS_?AUTOMIN, AXS_?AUTOMAX: configures the automatic scaling of the minimum and maximum display values. Can be YES or NO. Default: YES.
AXS_?ARROW: enable or disable the axis arrow display. Can be YES or NO. Default: YES.
AXS_?COLOR: ticks values and label color. Default: "0 0 0".
AXS_?CROSSORIGIN: same as setting AXS_?ORIGIN to 0 or NULL. Can be YES or NO. Default: NO. Returns YES if AXS_?ORIGIN is 0 and returns NO if AXS_?ORIGIN in NULL. Available for compatibility with IupPlot, but the default is different.
AXS_?FONTSIZE: axis label font size factor. Default: 0.8. The internal MathGL factor is 1.4.
AXS_?FONTSTYLE: axis label font style.
AXS_?LABEL: text label of the respective axis.
AXS_?LABELCENTERED: text label position at center (YES) or at top/right (NO). Default: YES. Will set/get AXS_?LABELPOSITION to CENTER or MAX. Available for compatibility with IupPlot.
AXS_?LABELPOSITION: text label position. Can be CENTER, MAX or MIN. Default: CENTER.
AXS_?LABELROTATION: enable or disable the text label rotation along the 3D axis. Can be YES or NO. Default: Yes. This means that text will be aligned with the axis even when rotating the graph. When NO text will be horizontal, always facing the camera, independently from graph rotation. For 2D graphs is useful to the Y axis only.
AXS_?MAX, AXS_?MIN: minimum and maximum displayed values of the respective axis in plot coordinates. Automatically calculated values when AUTOMIN or AUTOMAX are enabled. Default: 1.0 and -1.0. When set will set the correspondent AUTOMIN or AUTOMAX to NO (since 3.11).
AXS_?ORIGIN: position the origin of the axis in plot coordinates (%g). But if set to NULL will automatically position the origin at the bottom-left corner of the dataset area. Default: not defined.
AXS_?REVERSE: reverse the axis direction. Can be YES or NO. Default: NO. Default is Y oriented bottom to top, and X oriented from left to right.
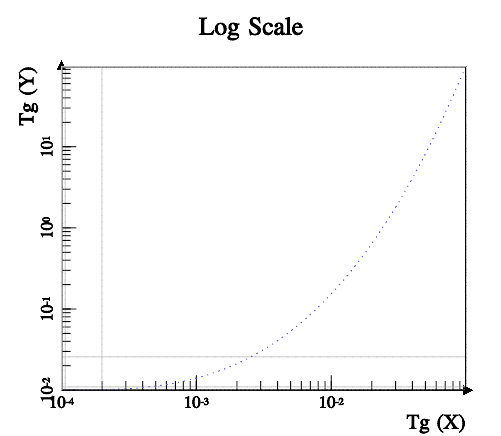
AXS_?SCALE: configures the scale of the respective axis. Can be: LIN (linear) or LOG10 (decimal logarithm base 10). Default: LIN.
AXS_?TICK: enable or disable the axis tick display. Can be YES or NO. Default: YES.
AXS_?TICKAUTO: configures the automatic tick spacing. Can be YES or NO. Default: YES. AXS_?AUTOTICK is also accepted.
AXS_?TICKAUTOSIZE: configures the automatic tick size. Can be YES or NO. Default: YES. AXS_?AUTOTICKSIZE is also accepted.
AXS_?TICKFONTSIZE: axis tick number font size factor. Default: 0.8. The internal MathGL factor is 1.0.
AXS_?TICKFONTSTYLE: axis tick number font style.
AXS_?TICKFORMAT: axis tick number C format string. Default: is internally computed according to the Min-Max range.
AXS_?TICKMAJORSIZE: axis major ticks size in normalized coordinates. Default is 0.1. Used only when TICKAUTOSIZE is disabled.
AXS_?TICKMAJORSPAN: spacing between major ticks in plot coordinates if positive, or number of major ticks along the axis range if negative. Default is -5 when TICKAUTO is disabled.
AXS_?TICKMINORDIVISION: number of minor ticks intervals between each major tick. Default is 5 when TICKAUTO is disabled. AXS_?TICKDIVISION is also accepted.
AXS_?TICKMINORSIZE: axis minor ticks size factor. It is a multiple of the AXS_?TICKMAJORSIZE. Default is 0.6. Used only when AUTOTICKSIZE is disabled. AXS_?TICKSIZE is also accepted.
AXS_?TICKVALUES: enable or disable the axis tick values display. Can be YES or NO. Default: YES.
AXS_?TICKVALUESROTATION: enable or disable the axis tick values rotation along the 3D axis. Can be YES or NO. Default: YES (NO for Y axis). This means that text will be aligned with the axis even when rotating the graph. When NO text will be horizontal, always facing the camera, independently from graph rotation. For 2D graphs is useful to the Y axis only.
ACTIVE, SCREENPOSITION, POSITION, MINSIZE, MAXSIZE, WID, TIP, SIZE, RASTERSIZE, ZORDER, VISIBLE: also accepted.
PREDRAW_CB, POSTDRAW_CB: Actions generated before and after the redraw operation. They can be used to draw additional information in the plot. Use only the IupMglPlotDraw* functions. For display output OpenGL primitives can also be used.
int function(Ihandle *ih); [in C]
ih:predraw_cb() -> (ret: number) [in Lua]
ih:postdraw_cb() -> (ret: number) [in Lua]
ih: identifier of the element that activated the event.
MAP_CB, UNMAP_CB, DESTROY_CB, GETFOCUS_CB, KILLFOCUS_CB, ENTERWINDOW_CB, LEAVEWINDOW_CB, K_ANY, HELP_CB: All common callbacks are supported.
 |
 |
 |
 |
 |
Uses OpenGL for screen output and internal drivers for metafile output. IupPlot uses CD for screen and metafile output.
Selection and editing of a dataset using the DS_EDIT attribute are not implemented.
All functions use double floating point. (since 3.11)
New support for 3D data and 3D plots. New support for planar and volumetric data. New ALPHA, ANTIALIAS, DS_DIMENSION, LEGENDBOX, BOX, BOXTICKS, BOXCOLOR, AXS_*ORIGIN, AXS_?LABELPOSITION, AXS_?LABELROTATION, AXS_?TICKVALUESROTATION, LEGENDCOLOR, TITLECOLOR, LIGHT, COLORBAR*, COLORSCHEME attributes. Many new DS_MODE options.
USE_IMAGERGB and USE_GDI+ attributes are NOT supported. MARGIN* attributes are NOT supported. AXS_?SCALE attribute does NOT support the LOG2 and LOGN values. The Crosshair cursor is not supported.
The PREDRAW_CB, POSTDRAW_CB callbacks does not includes the CD canvas parameter. *FONTSIZE attributes are a multiple factor of the FONT size. DASH_DOT_DOT line style is not supported, but has new line styles: LONGDASHED, SMALLDASHED and SMALLDASH_DOT. AXS_?TICKMAJORSIZE, MARKSIZE are in normalized coordinates. New options for GRID: Z, XYZ, XZ, YZ. AXS_?TICKSIZE renamed to AXS_?TICKMINORSIZE, and is a factor of the AXS_?TICKMAJORSIZE. AXS_?TICKMAJORSPAN default value is -5. AXS_?TICKFORMAT default is internally computed according to the Min-Max range.
Function Mapping:
IupPlotBegin  -> IupMglPlotBegin    (IMPORTANT: parameter is the dimension 1, 2 or 3)
IupPlotAddStr -> IupMglPlotAdd1D
IupPlotAdd    -> IupMglPlotAdd2D
   (none)         IupMglPlotAdd3D
IupPlotEnd    -> IupMglPlotEnd
   (none)            IupMglPlotNewDataSet
IupPlotInsertStr    (not mapped, use IupMglPlotInsert1D)
IupPlotInsert       (not mapped, use IupMglPlotInsert2D)
IupPlotInsertStrPoints -> IupMglPlotInsert1D   (names array is optional)
IupPlotInsertPoints    -> IupMglPlotInsert2D
   (none)                  IupMglPlotInsert3D
IupPlotAddStrPoints    -> IupMglPlotInsert1D   (insert at DS_COUNT)
IupPlotAddPoints       -> IupMglPlotInsert2D   (insert at DS_COUNT)
   (none)                  IupMglPlotInsert3D
   (none)                  IupMglPlotSet1D
   (none)                  IupMglPlotSet2D
   (none)                  IupMglPlotSet3D
   (none)                  IupMglPlotSetData
   (none)                  IupMglPlotLoadData
   (none)                  IupMglPlotSetFromFormula
IupPlotTransform       -> IupMglPlotTransform  (includes z coordinate)
   (none)                  IupMglPlotTransformXYZ
   (cdCanvasMark)       -> IupMglPlotDrawMark
   (cdCanvasLine)       -> IupMglPlotDrawLine
   (cdCanvasText)       -> IupMglPlotDrawText
IupPlotPaintTo         -> IupMglPlotPaintTo    (parameters are different)